There is speculation that the Chancellor may allow local authorities to raise council tax by 2% to help fund social care as part of the Spending Review. It looks neat, but how would this policy play out?
Total receipts of council tax collected during 2014-15 were £24bn (from data collected in August 2015). An additional 2% would bring in just under £ ½ bn. If councils did this successively over four years, then they would raise around £2bn extra for social care in 2020.
The question isn’t whether the 2% per annum increase in resources for social care will be sufficient to cover the social care funding gap. We know that it won’t: the gap is estimated at around £6bn by 2020.
But, will this approach succeed as a stop gap measure?
The first concern might be that such a step raises the burden on council tax which is a regressive tax. This perhaps is not as worrying as may first be concluded, because the wealthier are hit proportionally harder by the government’s postponement of its cap on care costs. The consequence of the latter is that it will be more difficult for middle England to qualify for means-tested social care, and wealthier households remain exposed to huge financial risk associated with their care needs in later life. So, if taken together (the implementation of a council tax rise alongside the failure to implement the cap), these policies are unlikely to be hugely regressive.
However, the more fundamental problem is the significant distributional consequences between local authorities of using council tax to shore up social care costs. These derive from the markedly varied level of resources that are raised by local authorities from council tax as well as the demand from their older populations.
Because they have very different population sizes, you would expect councils to raise very different levels of council tax. For instance, Surrey County Council brought in £754m, whilst Rutland Unitary Authority brought in £24m. However, Figure 1 below gives the income from council tax receipts per head of population by each local authority. As can be seen there is marked differentiation even when population is accounted for: while the London Borough of Richmond brings in about £714 per year per person, the London Borough of Newham brings in nearer to £250. London Boroughs are over-represented at the bottom, as are councils in the north. Authorities south of the midlands are under-represented at the bottom.
Figure 1: Council tax receipts per person (by local authority – not all named on axis)
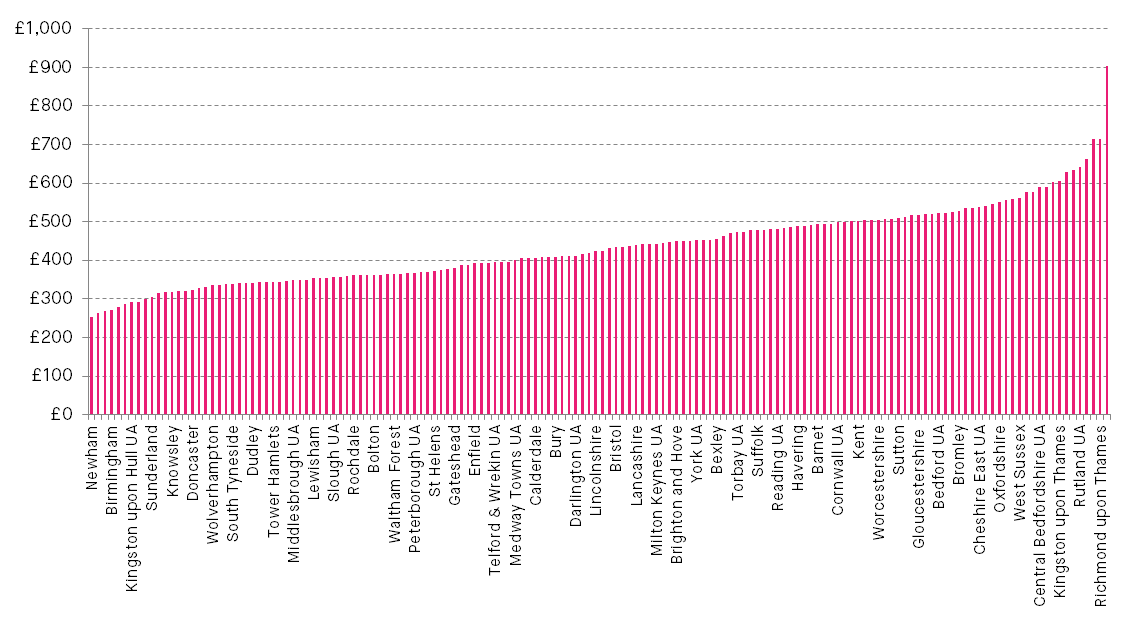
Source: See note
This still doesn’t tell us the real story of how well the 2% precept may enable councils to respond to the social care funding challenge in their local area via a 2% precept. A closer picture can be seen from Figure 2. This gives council tax income per person aged 65 or over.This gives us a better understanding of the ability of a council to resource the costs of their older population locally. Tower Hamlets (with the exception of the City of London) now leads the table with £5,651 per older person.
Under this metric, the situation of the London boroughs appears less severe because of their younger populations. There are no London councils in the bottom 50. Meanwhile, the plight of councils in the north is starker still. While a 2% precept would net Tower Hamlets £113 per older person in its borough, Sunderland would net only about £36.
Figure 2: Council tax receipts per person aged 65 or over (by local authority – not all named on axis)
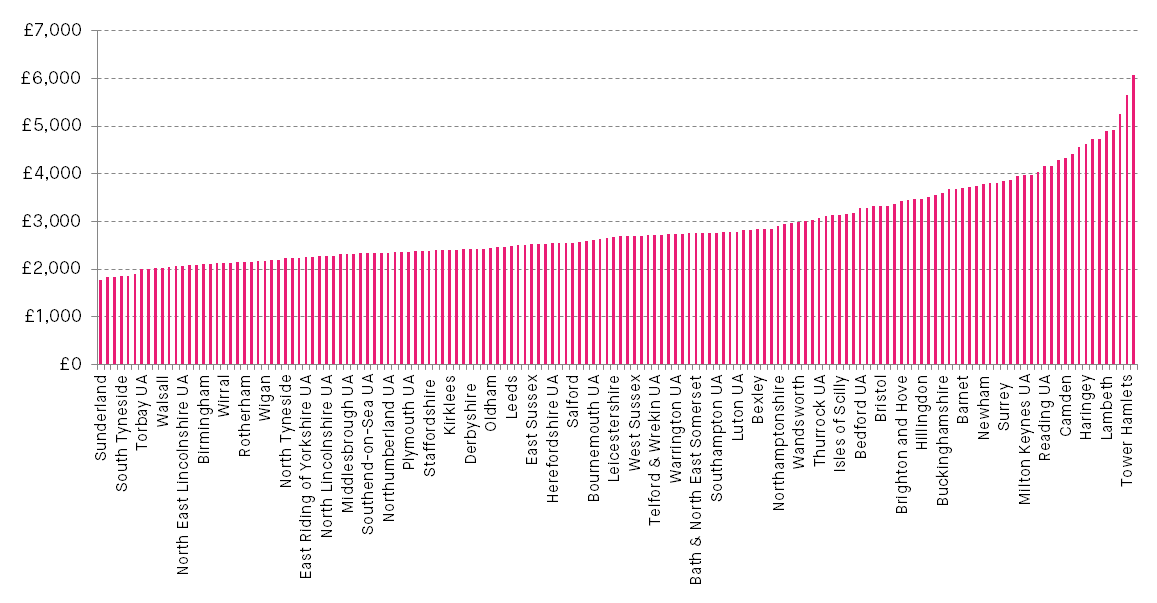
Source: See note
The variation between localities is more marked even than this. Those areas with lower council tax receipts are also often those with a higher proportion of the population that are eligible for means-tested social care. This certainly applies at a regional level: the NAO has found that southern regions outside London have a higher proportion of self-funders in care homes than northern areas where a higher proportion receive means-tested support.
In conclusion, there is huge variation locally in the extent to which a 2% council tax rise could help meet the social care funding crisis. For many local authorities the 2% precept is unlikely to offer a viable route to close the social care funding gap even as a short-term stop gap measure. After tying its hands on raising other sources of revenue – such as income tax and national insurance – the Government would be relying on a poor instrument to address the social care crisis.
So, what could the Chancellor do?
First, he could distribute some additional central government grant at the same time thus cushioning the blow in localities where council tax won’t raise much. The chances of this may seem slim given the likely reductions to the budget for Communities and Local Government.
Second, and more likely, he could find further resources from within the health budget. Prior to the election Sir Simon Stevens asked for an additional £8bn over the course of the parliament. The Government is set to commit an additional £10bn over the parliament. The Government could either explicitly use this leeway to honour its pledge whilst plugging the social care gap or do this by the backdoor and bolster the Better Care Fund for social care and health.
Third, the Government could re-think its care cap and try and bring forward some of the revenues from self-funders (those who pay for their own social care). For instance, this could include providing certainty on when the care cap is coming in and at what level, before allowing individuals at a given age to pay an upfront charge to the government to cover their liabilities up to the cap.
Fourth, and in the longer term, we need a more radical and thorough overhaul of the funding of health and social care to set them on a more sustainable footing for the decades ahead. The starting point should be that social care and health are treated on the same basis.
The SMF will be looking in more depth at social care funding in 2016. Please contact us if you would like to discuss your ideas please contact me via nigel@smf.co.uk.
—
Note on figures used
Individual local authority receipts from council tax were taken from ‘Receipts of council taxes in respect of 2014–15’ from Table 2, Council Tax receipts live table, England, 2014 to 2015 and Q1 2015 to 2016. https://www.gov.uk/government/statistical-data-sets/live-tables-on-local-government-finance
For upper tier county councils, we used the sum of the district authorities within that local authority area.
The population estimates are taken from the ONS’s Mid-2011 Population Estimates: Selected age groups for local authorities in England and Wales; estimated resident population.