Sustained real-terms losses to earnings and heightened exposure to harm while on duty prompt questions about the adequacy of police officers’ salaries. This blog, sponsored by the Police Federation, examines UK police pay and discusses the ‘P-Factor’, a pay policy that renumerates officers for risks and restrictions inherent to the profession.
In March 2023, the SMF carried out analysis of police pay, revealing a real-terms decline for officers over the past decade, while projecting a continued decrease in spending power in the years ahead.
Using the most recent data, this blog provides an update of that work. While estimates have remained relatively stable, the impact of inflationary pressures suggests that the outlook for police pay is now anticipated to worsen beyond last year’s expectations.
A quick note on data
The analysis of police pay levels is based on data from the Office for National Statistics (ONS). They run an Annual Survey of Hours and Earnings every April, which presents data from across professions.
For policing, they give the results in two groupings: “Police officers (sergeant and below)” and “Senior police officers”, which includes everything from inspector and above. The ONS data does not therefore allow for a division into federated and unfederated police officer ranks. The results in this blog take an average of the “Police officers” and “Senior police officers” categories, weighted based upon the number of officers in each grouping. This average thus includes all ranks from Constable up to Chief Officer and Superintendent.
However, there were only 1,685 superintendents, chief superintendents and chief officers as of March 2023 in the unfederated ranks, compared to c150,000 in federated ranks. The results presented in this report, then, will be overwhelmingly dominated by the federated ranks, which represent 98-99% of the sample.
The real value of police pay has decreased significantly
Analysis of ONS earnings data shows that police officer pay rose by 40% between 2000 and 2023.[1] [2] [3] However, when compared with the pay change of other workers – protective service officers (75%),[4] public sector workers (98%), and those employed in the private sector (85%) – this increase becomes less impressive. MPs, as an additional comparator group, have seen their salaries increase by 79%.
In real terms, taking into account inflation of 80% over the past two decades, this equates to an actual decline in police pay of 22% between April 2000 and April 2023. Within the broader protective services occupation category, which refers to police, fire, and prison officers collectively, the overall decrease has been much smaller (-3%), suggesting a substantial erosion of purchasing power for police officers compared with analogous roles.
In contrast, the average public sector worker has seen their salary increase in real terms (10%), as has the average private sector worker (3%). MPs salaries have remained unchanged (0%) in real-terms. While this does not categorise them as a complete outlier, it does highlight that police officers have become significantly worse off compared to their counterparts in other occupations.
The police received a 7% pay rise, coming into effect in September 2023, after the ONS survey was taken. This takes the average pay, which includes the federated and unfederated ranks as per the ONS data, from £43,829 in 2023 to £46,897 in 2024. It is possible to use this, as well as inflation forecasts for 2024, to forecast a 19.5% decline in real pay from 2000 to 2024. This means they will have slightly more purchasing power this year than they did in 2023. The 2023-24 pay deal data for the comparison professions is not available, so Figures 1 and 2 are based upon the 2000 to 2023 data from the ONS surveys.
We also looked at what would happen if these trends were to continue. With prices expected to increase – the OBR forecasts 11% growth in the Consumer Price index by 2028 – unless changes are made to how much officers earn in the coming years, our analysis suggests the real-terms value of police pay will continue to decline.
Rolling forward the 2000 to 2023 pay trends, a further 5% pay reduction for police officers between 2023 and 2028 is implied, compared to a rise in pay for public sector workers (2%) and private sector workers (1%). The pay of MPs (0%) is expected to remain the same, while protective service officer earnings are also set to decline (1%).
Another way of examining earnings growth is by looking at starting salaries. From 1979, we find that the pay trajectory of new police constables, though not showing a real-terms decline, has risen slower than earnings across the economy. The starting salary of new constables, at £3,600 was almost exactly in line with the salary of the average worker in 1979, at £3,608. Constable starting salaries then increased by 71% in real terms across this period, while the pay of all workers has increased by 108%.
As displayed in Figure 4, in 2023 new police constables earned £28,551, a nominal increase of £24,951, while the average worker earned £34,855, a much larger increase of £31,247.
Dissatisfaction with police pay is widespread
The vast majority of police are unhappy with the amount they are paid. The Police Federation of England and Wales (PFEW)’s 2023 Pay and Morale Survey of around 30,000 police officers has found a substantial 79% expressed dissatisfaction with basic pay and 78% with overall remuneration.
Considering the stresses and strains they experience at work, PFEW data also reveals that the vast majority (92%) of police officers disagree with the notion they are fairly paid. Similarly, 85% disagree that they are fairly paid considering the hazards they face within the job. Illustrating a significant lack of morale in the police force, more than half (52%) state that their current level of pay increases their intention to leave the police service entirely.
Police pay and the ‘P-Factor’
Another aspect in the discussion around police pay are the inherent dangers officers face while in the line of duty. Because police have unique obligations and responsibilities compared to most other jobs – responding to emergency calls, maintaining public order, and handing potentially dangerous situations – they can often find themselves exposed to an increased level of harm, as well as other restrictions.
Within policing circles, this is commonly referred to as the ‘P-Factor’. It is argued this factor should be duly acknowledged in police pay structures, remunerating officers for the challenges they may encounter as a result of carrying out their duties.
The practical implementation of this concept remains uncertain, however. For example, it could serve as a base pay policy that incorporates compensation directly into officer’s salaries, or the P-Factor could be added on to base pay.
The National Police Chiefs’ Council (NPCC) has proposed that there are 12 elements in total that contribute to the day-to-day risks faced by officers; factors that should be taken into consideration and incorporated into the design of the P-Factor as part of pay reform (see appendix 2). This includes risks typically associated with the role, such as physical confrontation or psychological hazards, as well other legal and socioeconomic factors.
For example, the NPCC say that, due to being legally obliged to act to prevent crime even when not working, it could be argued that police officers are never truly ‘off duty’. Nonfeasance can affect officers’ ability to enjoy their private life, as well as risking safety. The Council also emphasises that police are victimised because of their profession, leading to the damage of personal property, bullied children, or threats made while off duty.
Further research is required
The value of police pay has eroded in real terms since 2000, and to a greater extent than similar roles in the protective services. Officer dissatisfaction is widespread, with opinions on pay increasing peoples’ intention to leave the service.
There is a strong argument for increasing transparency around the P-Factor. What precisely does it include, how are these valued, and – crucially – how is it accounted for in policy pay. To address these questions, further research is needed to nail down the principles underpinning the P-Factor, developing an appropriate methodology for calculating it, and thus identifying what the appropriate level of renumeration should be across duties and roles.
Appendix 1 – Methodology
This appendix details the calculations behind the pay analysis used to produce Figures 1-4, showcasing new SMF analysis. It explains the sources and methods used, while also addressing potential limitations.
Figure 1: Nominal annual gross pay for select occupations and sectors
These calculations were derived from ONS employment and labour market data. First, it drew upon earnings by occupation data, covering police and protective service officers from 2000 to 2023. For police officers and protective service occupations, data is reported separately for senior and non-senior staff. The analysis takes an average of these, weighted based upon the number of jobs in each category, to combine senior and non-senior pay into a single occupational category.
ONS data was also used for public and private sector earnings, covering the same period. House of Commons Library data was used for recent MP earnings, while previous library briefing papers on members’ pay was used for timeseries data (see Appendix 5). Pay growth involved a straightforward calculation of the percent change for respective occupations between 2000 and 2023.
As indicated in the footnotes, there are some limitations to this data. First, ONS pay data for 2023 is currently provisional, and may contain inaccuracies. As a result, figures used in this briefing may undergo revisions over time. There is also a methodological change between 2005 and 2006 in the ONS pay data series, while police officer pay is unavailable for 2002. Though we suggest a degree of caution while interpreting this data, we consider these minor considerations that do not significantly impact the results of the analysis.
Figure 2: Real annual gross pay change
This chart uses the same calculations as those in Figure 1, but with an added consideration for price inflation. To do this, mean nominal pay for police officers, protective service officers, public sector workers, private sector workers, and MPs in 2000 and 2023 was adjusted for the level of CPI in 2000. The real difference between 2000 and 2023 is then shown as a percent change, showing inflation-adjusted pay and how it has changed over time. ONS Consumer Price Index data served as the basis for 2000 CPI figures. The same caveats highlighted in Figure 1 are also applicable to Figure 2.
Figure 3: Projected real-terms pay index
Drawing on the same data, we then looked at the potential impact of ongoing inflation trends. The Compound Annual Growth Rate (CAGR) was used as a predictive tool, revealing an extrapolation of -1.1% for police officers, -0.1% for protective service officers, 0.4% for public sector workers, 0.1% for private sector workers, and 0.0% for MPS from 2000 to 2023.
To maintain comparability between different professions, the September 2023 pay deal is not taken into account here, as the comparable pay deals for other professions are not available.
These CAGR calculations were taken from the real-terms pay estimates outlined in Figure 2, providing a smoothed representation of rates and offering a gradual measure of price growth over time. CAGR figures were then applied to workers’ 2023 earnings, projecting earnings change over the next five years until 2028. The CPI inflation rates for 2024-2028 were sourced from OBR forecast data.
Figure 4: Nominal annual starting pay
To establish 1979 earnings, data from the Home Office was used for new constables and Bank of England data was consulted for the average worker. 2023 earnings drew upon Police Federation reporting of constable pay scales, while latest average worker pay was drawn from the ONS. To account for inflation, real earnings were calculated using 1979 Bank of England CPI data, and current ONS data for 2023 prices. Pending the release of Q4 figures, all workers earnings data for the whole of 2023 is currently unavailable. Data from Q3 2023 has been used instead. Were full year 2023 used for Figure 4, pay for all workers would be expected to be slightly higher.
Appendix 2 – Proposed P-Factor elements
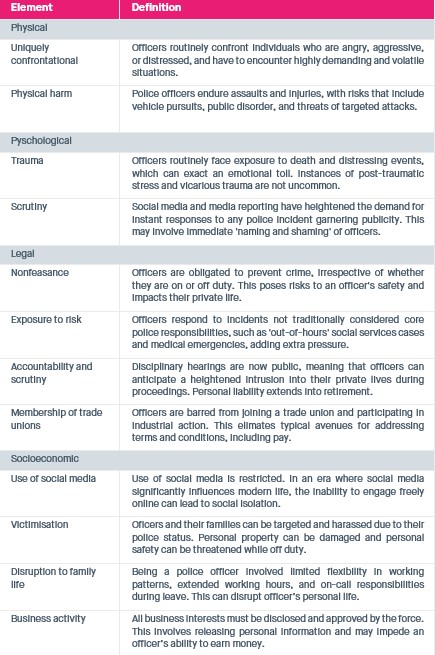
Source: National Police Chiefs’ Council – see p.53 in the full report for details
Footnotes
[1] ONS pay data for 2023 is currently provisional, and may contain inaccuracies. As a result, figures used in this briefing may undergo revisions over time. Estimates should be approached with a degree of caution.
[2] There is a methodological change between 2005 and 2006 in the ONS pay data series. For protective services officer and police officer pay, we have included data on both senior and non-senior staff pay.
[3] Police officer pay is unavailable for 2002.
[4] Protective services occupations are jobs that exist to maintain order and ensure public safety, including police officers, members of the armed forces, firefighters, prison officers, and paramedics.